
Design Toolbox: Helping Pugh make the right choice
The Pugh matrix is an effective tool to help anyone, from Engineers choosing the right part for a project to a first time buyer choosing the best mortgage and even the best property. The Pugh Matrix can be applied to a diverse range of applications empowering anyone who uses it to move forward with confidence in their decision. It also removes the daunting task of having to choose from a wide variety, setting the procrastinator free!
When making critical design choices between one solution or the another, the decision is rarely simple. It will often be the case that option A out performs option B in some areas, but option B fulfils other criteria option A does not.
So how do you confidently choose the best option? Pick one important factor and use that to decide, ignoring other factors which are equally important or slightly less than the factor you chose but are important nonetheless? What if there are more than two or three criteria you must consider?
This was a challenge we faced when selecting UVC LEDs from a wide variety of manufacturers. Having listed out the critical performance parameters and key requirements, wavelength, output radiant flux and exposure angle for example, then our search for the perfect component began. Each UVC LED found would firstly have its datasheet assessed immediately. Wavelength, check, exposure angle, check, radiant flux… darn, onto the next one. Radiant flux, check, exposure angle, check, wavelength… not again. And so they cycle repeated. As is often the case we began to consider no component found would meet every single one of the desired requirements.
So how do to choose the best option?
A colleague suggested using a Pugh Matrix and this is the perfect addition to the toolbox when selecting between alternates.
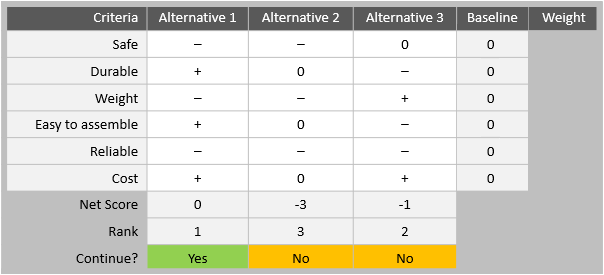
Example of a Pugh Matrix
Background / History
The Pugh Matrix was developed by Professor Stuart Pugh, who was an engineering professor at Strathclyde University. It formed part of his best known, publication "Concept Selection – A Method that Works".
So, how to use it and empower your decision making
Quick guide:
- List key factors which are critical to quality
- Give each key factor a weighting signifying its importance
- Choose your benchmark - one of the concepts or alternatives
- Rank each alternative against the benchmark
- Multiply each rank by the weighting
- Add up the multiplied ranks to produce a final score
- Assess results and iterate through the Pugh Matrix if necessary
For a more detailed guide to each step, see below:
To begin, list out all the key factors which are likely to make a significant difference to customer satisfaction. Whilst tempting, try not to list absolutely every factor. For example, when selecting an UVC LED, we chose only wavelength and radiant flux as critical.
Give each key factor a weighting, between 1 and 5 is typical, with 5 being the most important. We recommend relating this to the Kano model of customer satisfaction, using only ratings of 1, 3 or 5.
Then, choose your benchmark and score for each key factor listed. Always baseline your benchmark with a real example, generally the item you are most familiar with or a known concept is best.

Pugh matrix set up showing the Key factors (Criteria), weight to signify importance and baseline to be used for comparison
Now the ranking begins. Each component is considered with each key parameter and ranked against the benchmark. It receives a score of 1 if it is better than the benchmark, 0 if it is the same and -1 if it is worse than the benchmark. Depending on the critical to quality parameter, a threshold might need to be defined. For example, if comparing cost, the benchmark costs £10 and the items you are comparing costs £9.90 and £5. Technically yes, both are cheaper than the benchmark and would receive a ranking of 1, but perhaps it would be better to define a threshold, anything ±£2 will be considered better or worse than the benchmark and anything under will be considered the same as the benchmark.
The ranks are then multiplied by their weighting. This takes the performance of what you are comparing and amplifies it by how important each key factor is.
The multiplied ranks are then added and a final score obtained. The one with the highest score should meet your requirements the closest. I say should because, the Pugh matrix is a tool and not the decision maker, that would be you. The Pugh matrix will aid in your decision making but it should not make the decision for you.
Once you get your result from the Pugh matrix you should ask yourself, does the result make sense? Am I surprised by the result? Do I agree with the result? The Pugh matrix is an iterative process, once complete, you should go back and look at the weightings, what happens to the result if you change the importance given to some of your key factors?
Our hot tip is to use the tool to explore the alternate solutions and the sensitivity of your decision making to different criteria and different assumptions.
Now Pugh can rest easy with this powerful decision making tool!